

The Importance of Customer Satisfaction in a Data-Driven Era
The ability to understand and exceed customer expectations hinges on data. Data provides insights into customer preferences, behaviors, and pain points, enabling businesses to craft personalized experiences. From online interactions to in-store purchases, every touchpoint generates valuable information that can reveal trends and opportunities for improvement. Analyzing this data allows businesses to anticipate needs, address issues proactively, and create tailored strategies to foster long-term relationships.
Data visualization and reporting tools play a pivotal role in this process. These tools transform complex datasets into intuitive, actionable insights. Dashboards, charts, and reports allow decision-makers to track key performance indicators (KPIs) like customer satisfaction scores, response times, and retention rates in real-time. By presenting data in a clear and accessible manner, visualization tools empower teams to identify patterns, monitor progress, and make data-driven decisions swiftly. As a result, these tools are integral to developing customer-centric strategies that prioritize satisfaction and loyalty in a dynamic, fast-paced.
The Power of Data in Customer Satisfaction
The measurement of customer satisfaction has evolved significantly over the years. Traditional methods, such as surveys and feedback forms, once dominated the landscape. While these approaches provided useful insights, they were often limited in scope and reactive in nature. Today, businesses have access to a wealth of real-time data generated through digital interactions, offering a more nuanced and proactive understanding of customer satisfaction. Advanced analytics tools and metrics have replaced the guesswork with data-driven strategies that can predict and address customer needs effectively. Three key metrics stand out in this evolution:
- Net Promoter Score (NPS): This measures the likelihood of customers recommending a product or service to others. It provides a quick snapshot of customer loyalty and brand advocacy.
- Customer Satisfaction Score (CSAT): CSAT gauges immediate satisfaction with a specific interaction or product. It is particularly useful for identifying areas of improvement in real-time.
- Customer Effort Score (CES): CES focuses on the ease of interaction, highlighting whether customers face friction while resolving issues or completing tasks. Reducing effort often leads to higher satisfaction.
Despite these advancements, businesses face significant challenges in leveraging data without proper visualization and reporting tools. Scattered data across multiple systems makes it difficult to compile a unified view of customer satisfaction. Raw data alone can overwhelm teams, offering little clarity or actionable insights. Additionally, traditional reporting methods may not provide the flexibility to identify patterns, trends, or anomalies in customer behavior.
This is where visualization and reporting tools become indispensable. These tools aggregate and organize data from diverse sources, presenting it in easy- to-understand formats like graphs, dashboards, and heatmaps. They enable businesses to drill down into specifics or gain a bird’s-eye view of overall performance. Without these tools, decision-makers risk missing critical insights, leading to reactive rather than proactive strategies.
In a competitive environment, the ability to harness data effectively is a game-changer. Businesses equipped with robust visualization tools can identify gaps, track improvements, and foster customer satisfaction at every touchpoint, driving loyalty and long-term success.
The Role of Data Visualization Tools
In today’s data-driven world, businesses rely heavily on data visualization tools to make sense of the vast amounts of information they collect. These tools transform raw, complex data into visual formats that are easy to interpret, enabling quicker and more informed decision-making. Tools like Tableau, Power BI, and Google Data Studio are among the most popular for creating dashboards, charts, and interactive reports. They allow businesses to monitor metrics, analyze trends, and uncover actionable insights in real-time. One of the most significant advantages of data visualization is its ability to convert overwhelming datasets into comprehensible insights. For instance, customer satisfaction data collected through surveys, chat logs, or purchase histories an e transformed into visualizations that highlight customer behavior patterns. A line chart, for example, may reveal seasonal trends in customer satisfaction, while a bar graph could compare satisfaction levels across different customer segments.
Data visualization tools also excel at identifying trends and patterns. For example, a retail business might use a dashboard to track customer preferences over time, identifying which products drive the highest satisfaction. Similarly, analyzing metrics such as response times or resolution rates through graphs can reveal bottlenecks in customer service workflows. Spotting pain points in real-time is another critical capability. Heatmaps, for example, can show areas of a website where users frequently encounter difficulties, such as broken links or confusing navigation. Similarly, dashboards can alert teams to dips in Net Promoter Scores (NPS) or spikes in unresolved customer complaints, enabling immediate action. Effective visualizations come in many forms, each tailored to specific purposes. Dashboards provide an overview of key performance indicators (KPIs), allowing businesses to track progress at a glance. Heatmaps visualize customer interactions, making it easier to pinpoint problem areas. Interactive graphs allow users to drill down into data, uncovering granular details for deeper analysis.
The impact of these tools is evident in real-world applications. For example, a leading e-commerce company implemented Tableau to track customer satisfaction metrics. By visualizing NPS and customer effort scores across different regions, they identified areas requiring attention and optimized their customer service processes. Within months, the company reported a significant increase in satisfaction rates. In another case, a telecom provider used Power BI to monitor call center performance. Real-time dashboards revealed that wait times were consistently higher during specific hours. By reallocating resources and training staff, they reduced wait times and improved overall satisfaction.
These examples demonstrate how data visualization tools empower businesses to be proactive, not reactive. By making data accessible and actionable, they enable organizations to enhance customer experiences, address pain points efficiently, and foster loyalty. As the competition intensifies, leveraging visualization tools is no longer a luxury but a necessity for businesses striving to remain customer centric.
Advanced Reporting for Better Decision-Making
In the modern business landscape, robust reporting mechanisms are critical to managing customer satisfaction effectively. With customers expecting seamless and personalized experiences, businesses must rely on comprehensive reports to gain actionable insights into customer behavior, preferences, and pain points. Advanced reporting not only highlights current performance but also serves as a strategic tool for anticipating and addressing future needs.
Types of Reports for Customer Insights
- Real-Time Reports for Instant ActionReal-time reports provide immediate visibility into customer satisfaction metrics. These reports are particularly useful in dynamic environments where swift responses are essential. For instance, a real-time dashboard displaying spikes in customer complaints allows teams to investigate and resolve issues promptly, minimizing customer frustration. Metrics such as response times, live chat satisfaction, or support ticket volumes are often tracked in real-time, ensuring that businesses remain agile and proactive.
- Historical Reports for Trend AnalysisHistorical reports analyze past data to identify patterns and trends over time. These reports help businesses understand seasonal variations, customer behavior changes, or long-term satisfaction trends. For example, comparing Net Promoter Scores (NPS) across quarters can reveal whether specific strategies or changes, such as new product launches or process improvements, positively impacted customer satisfaction.
- Predictive Reports for Forecasting Customer NeedsPredictive reports leverage advanced analytics and machine learning to forecast future customer needs and behaviors. By analyzing historical data, these reports predict trends such as potential churn rates or upcoming product demands. For example, a predictive report might highlight that customers who contact support multiple times in a week are at higher risk of dissatisfaction, prompting targeted retention strategies.
- Automating Reports for Efficiency and AccuracyAutomation streamlines the reporting process, reducing manual effort and minimizing errors. Automated reports are generated at pre-scheduled intervals, ensuring stakeholders always have access to the latest insights. For example, weekly automated reports on Customer Satisfaction Scores (CSAT) can provide teams with regular updates, enabling them to track progress without manual intervention. Automation also allows businesses to scale their reporting efforts efficiently, even as data volumes grow.
Tools That Excel in Customer Satisfaction Reporting
Several tools stand out for their ability to deliver advanced customer satisfaction reporting:
- Salesforce: Offers customizable dashboards and reports that integrate with customer relationship management (CRM) data. It enables businesses to track satisfaction metrics like NPS and customer support performance.
- Zendesk: Specializes in support ticket management and reporting, providing insights into resolution times, customer feedback, and agent performance.
- HubSpot: Combines marketing, sales, and customer service data into unified reports, offering a 360-degree view of customer satisfaction. Its reporting automation features save time and enhance accuracy.
By leveraging these tools, businesses can generate actionable insights that drive better decision-making. Robust reporting mechanisms ensure that teams stay informed, proactive, and aligned with customer expectations. Whether through real-time monitoring, historical trend analysis, predictive insights, or automation, advanced reporting equips organizations with the knowledge they need to foster satisfaction, loyalty, and long-term success.
Enhancing Customer Experience Through Insights
The power of insights derived from visualization and reporting lies in their ability to drive actionable strategies that elevate customer experiences. By analyzing data from customer interactions, businesses can craft tailored solutions, resolve issues proactively, and anticipate customer needs. These strategies help organizations transition from reactive service models to proactive, customer-centric approaches.
Linking Insights to Actionable Strategies
- Personalization of Services and ProductsInsights from data allow businesses to understand individual customer preferences and behaviors, enabling personalized experiences. For example, e-commerce platforms often use purchase histories and browsing patterns to recommend products tailored to customer interests. Similarly, service-based businesses can offer customized solutions based on past interactions, increasing satisfaction and fostering loyalty.
- Improved Response Times in Customer ServiceReports highlighting customer wait times or unresolved tickets can inform strategies to optimize customer service workflows. Real-time insights allow managers to allocate resources dynamically, ensuring prompt responses during peak times. For instance, a telecom provider tracking support response rates may implement AI chatbots to handle simple queries, freeing human agents to address complex issues more quickly.
- Anticipating and Addressing Potential ComplaintsPredictive insights help businesses identify early warning signs of dissatisfaction. For example, frequent product returns or repeated support requests may signal underlying issues that need resolution. By addressing these concerns proactively, businesses can prevent complaints from escalating and improve overall satisfaction. Airlines, for instance, use predictive analytics to anticipate flight delays and communicate with passengers in advance, reducing frustration.
- Enhancing Proactive Customer Support with Real-Time InsightsReal-time data empowers businesses to monitor customer interactions as they happen. For example, a real-time dashboard tracking website performance might highlight increased abandonment rates at a particular checkout step. This insight allows the business to investigate and resolve the issue immediately, enhancing the customer experience. Proactive support also extends to monitoring social media for mentions and addressing concerns before they become widespread.
Success Stories
- Amazon: Amazon is renowned for using data-driven insights to personalize experiences. Its recommendation engine, powered by customer data, accounts for a significant portion of sales. By continuously analyzing browsing and purchase behavior, Amazon delivers tailored suggestions that resonate with individual customers.
- Zappos Zappos, known for exceptional customer service, uses reporting tools to monitor agent performance and customer satisfaction in real time. Insights from these reports allow the company to refine its processes, ensuring customers receive prompt and empathetic support.
- Netflix Netflix leverages viewing data to recommend content based on individual preferences. By analyzing user engagement metrics, it also identifies trends that inform original content production, delivering a superior viewing experience tailored to audience demands.
These examples demonstrate how insights from visualization and reporting tools can transform customer data into meaningful actions. Personalization, improved service efficiency, proactive support, and strategic decision-making are just some of the ways businesses can enhance customer experiences. Organizations that effectively leverage insights gain a competitive edge by fostering satisfaction, loyalty, and long-term growth.
Data Democratization and Cross-Team Collaboration
Data democratization, the process of making data accessible to all teams, empowers organizations to make informed decisions at every level. By providing equal access to customer insights, teams such as sales, marketing, customer service, and product development can align their efforts to create unified, customer-centric strategies. When data is shared across teams, collaboration flourishes. For example, a marketing team analyzing customer behavior can share insights with the sales team to tailor outreach efforts, improving conversion rates. Similarly, product development can benefit from feedback collected by customer service, using it to refine features or address pain points. Shared dashboards and reports serve as central hubs where all teams can access real-time data, fostering transparency and alignment. For instance, a company-wide customer satisfaction dashboard displaying Net Promoter Score (NPS) or Customer Effort Score (CES) enables teams to track progress collectively and contribute to common goals.
However, achieving seamless cross-team collaboration is not without challenges. Data silos, where information is isolated within specific departments, can hinder accessibility and lead to fragmented insights. Additionally, inconsistent reporting formats or metrics can create confusion and misaligned strategies.
To address these challenges, organizations should:
-
- Adopt unified data platforms that integrate data from various sources, breaking down silos. Tools like Salesforce or HubSpot can centralize customer data for cross-functional access.
- Standardize metrics and reporting formats to ensure consistency across teams. This includes defining KPIs that are relevant to all departments.
- Encourage a culture of collaboration by providing training on data tools and holding regular cross-departmental meetings to discuss insights and strategies.
By democratizing data and fostering collaboration, organizations can unlock the full potential of their teams, delivering innovative, customer- centric solutions that drive satisfaction and loyalty.
By democratizing data and fostering collaboration, organizations can unlock the full potential of their teams, delivering innovative, customer-centric solutions that drive satisfaction and loyalty.
Overcoming Challenges in Implementing Visualization and Reporting Tools
While the benefits of advanced visualization and reporting tools are undeniable, adopting them often comes with challenges. Organizations must navigate these hurdles to effectively leverage these tools for actionable insights and improved decision-making.
Common Hurdles
- Cost and Resource ConstraintsAdvanced tools like Tableau, Power BI, or Salesforce often come with significant licensing fees and implementation costs. Smaller organizations or those with limited budgets may struggle to allocate resources for these investments. Additionally, integrating these tools with existing systems may require skilled personnel or external consultants, further increasing expenses.
- Resistance to Change Among TeamsAdopting new tools often disrupts established workflows, leading to resistance from employees. Teams accustomed to traditional methods may view these tools as unnecessary or challenging to learn, causing delays in adoption. Misalignment between departments on the perceived value of these tools can also hinder implementation efforts.
- Ensuring Data Quality and AccuracyVisualization and reporting tools are only as effective as the data fed into them. Poor data quality—such as inconsistent formatting, missing information, or outdated records—can result in misleading insights. Ensuring accuracy and consistency across multiple data sources can be a time-consuming and complex process.
Strategies to Overcome Challenges
- Training and Change ManagementInvesting in training programs can help employees understand the value and functionality of these tools, reducing resistance. Demonstrating how these tools simplify their workflows and enhance productivity can drive buy-in. Change management strategies, such as involving key stakeholders early and communicating the benefits clearly, can also ease the transition.
- Choosing the Right ToolsNot all tools are suitable for every organization. Businesses should assess their specific needs, budget, and technical capabilities before selecting a solution. For example, smaller organizations might start with cost-effective tools like Google Data Studio, which offers robust reporting features without a high price tag. Scalability should also be a factor, ensuring the tool can grow alongside the business.
- Starting with Small-Scale ImplementationsA phased approach allows organizations to implement tools on a smaller scale before expanding usage. For instance, piloting a reporting dashboard for a single department can help identify challenges and fine-tune processes before company- wide adoption. Early successes from such implementations can build confidence and momentum among teams.
- Prioritizing Data Quality Establishing data governance practices ensures the accuracy and reliability of insights. This includes standardizing data entry processes, regular audits, and using automated tools to clean and validate data. Teams should also assign roles for data stewardship to maintain ongoing data integrity.
By addressing these challenges strategically, organizations can unlock the full potential of visualization and reporting tools, driving informed decisions and improved customer satisfaction.
Future Trends in Data-Driven Customer Satisfaction
The landscape of customer satisfaction is evolving rapidly, driven by advancements in technology and data analytics. The integration of artificial intelligence (AI), machine learning (ML), and other cutting-edge tools is transforming how businesses understand and address customer needs. As organizations strive to remain competitive, several key trends are shaping the future of data-driven customer satisfaction.
- Integration of AI and ML with Visualization and Reporting Tools
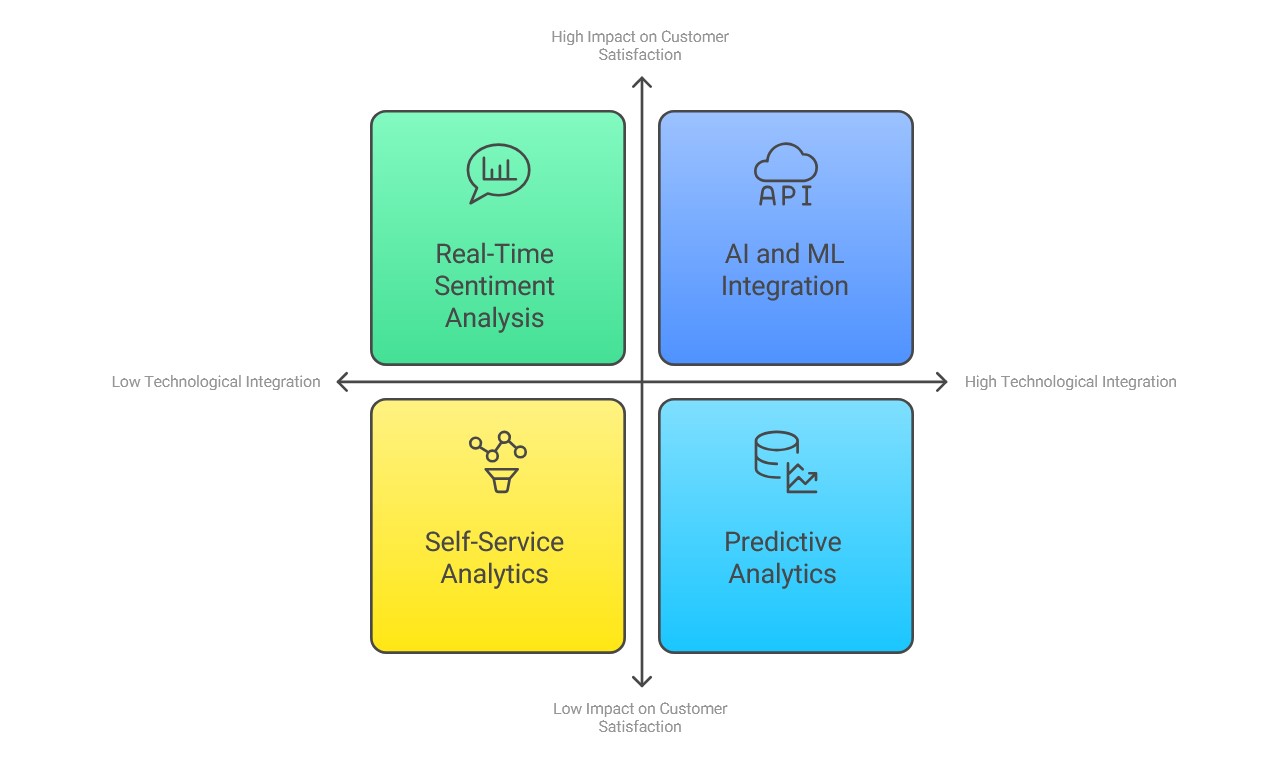
AI and ML are enhancing the capabilities of traditional visualization and reporting tools by automating data processing, uncovering hidden patterns, and generating actionable insights. These technologies can analyze vast datasets in seconds, providing predictions and recommendations that would take human analysts weeks to uncover. For example, AI-powered tools like Tableau’s AI extensions or Power BI’s AI capabilities can identify anomalies, predict customer behavior, and even suggest optimal courses of action, empowering businesses to stay ahead of customer demands. - Predictive Analytics for Anticipating Customer Needs
Predictive analytics is becoming a cornerstone of customer satisfaction strategies. By analyzing historical and real-time data, businesses can forecast future customer needs, preferences, and potential issues. For instance, retail companies use predictive models to anticipate product demand and stock levels, ensuring customers find what they need. Similarly, customer service teams can identify patterns in support tickets to proactively address common concerns before they escalate. - Real-Time Sentiment Analysis and Decision-Making
Real-time sentiment analysis, powered by AI, is revolutionizing how businesses gauge customer emotions. By analyzing data from social media, reviews, or chat logs, sentiment analysis tools provide instant feedback on customer perceptions. This enables companies to respond swiftly to negative sentiments, turning potential dissatisfaction into positive experiences. For example, a hospitality brand monitoring guest feedback in real- time can address issues during a guest’s stay, enhancing overall satisfaction. - The Rise of Self-Service Analytics
Self-service analytics tools are empowering non-technical users to access and analyze data independently. Platforms like Google Data Studio and Qlik Sense allow employees across departments to create their own reports and dashboards without relying on IT teams. This democratization of data fosters a culture of data-driven decision-making and ensures that insights are readily available to those who need them. Self-service analytics also accelerates response times, as users can quickly generate insights tailored to their unique challenges. The future of data-driven customer satisfaction lies in leveraging advanced technologies to uncover deeper insights, predict customer needs, and foster proactive engagement. Businesses that embrace these trends—AI and ML integration, predictive analytics, real-time sentiment analysis, and self-service analytics—will be better equipped to deliver exceptional experiences, ensuring customer loyalty in an increasingly competitive market.


Comments (0)